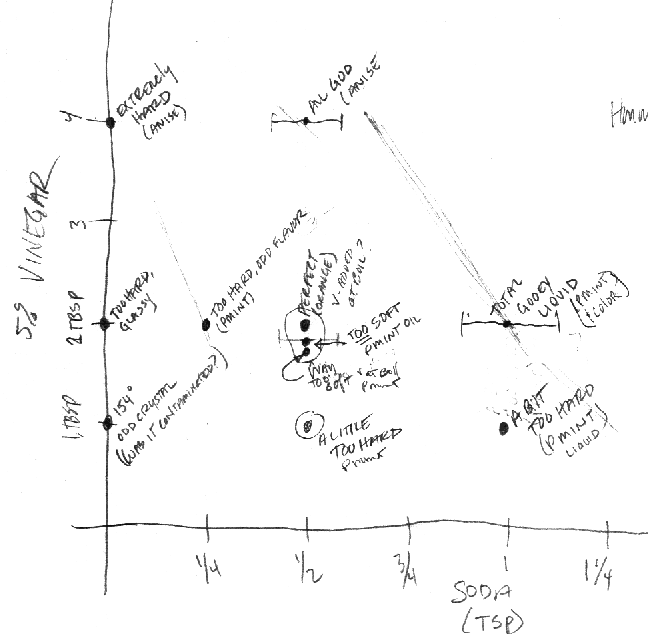
Polkagris graph
At some point I found that the center of the graph was blank. All around it I had batches that were not quite what I needed. I decided to shoot for the center.

One batch came out just about right. Oh man, I was psyched. I was done for the day, but tomorrow I would make another batch and start to dial in the exact variables. Three weeks of work and I was ready to declare victory.
The next day disaster struck.
Lost the recipe
Bright and early I was up on a rainy Sunday. I got out my candy paraphernalia and got to work. In just under an hour I had another batch, but this time it was way too soft! I quickly made another batch in the sweet spot and again it was too soft. Oh God, am I going to have to start all over again? I thought I was almost done. That was it for the day, I had to think.
My kitchen counter was strewn with little baggies of candy experiments. Each was labeled with the recipe used and any observations I had (thanks to Alice Medrich for the technique). Looking over my baggies I found that some of them were sweating. Little drops of water had formed on the candy. I pawed through the pile and one of the batches was soaked. Where did this water come from?
Batch after batch after batch had worn me out. It had been going on for six weeks. Doubts crept into my brain. Maybe my careful experimentation plan was all wrong. Could it have been the high humidity that caused the problem? When exactly did I add the soda? Was the amount of soda and vinegar a precision measure that I just happened to get right? As they say when a CMOS line goes bad, I had lost the recipe.
I was burned out and gave up. My graphs and notes all went into the cabinet above the stove and I put the project on the back burner [pun intended].